
Sunday, February 7, 2016
School Club Roundup is February 8-12; Some Rule Changes are in Place
02/07/2016
Young operators at school clubs across the country will take to the air for the “Winter/Spring Term” School Club Roundup, which gets under way Monday, February 8 at 1300 UTC, and continues through Friday, February 12, at 2359 UTC.
Because of changes in rules for the event, operators should ensure that their logging software is up to date:
- Contacts on digital modes such as RTTY and PSK31 now count separately from CW. Modes must be abbreviated in the Cabrillo-formatted log file as PH, CW, or RY.
- The number of contacts allowed per station has been changed to once per band per mode. Operators now may make up to three contacts with a station on each band using CW, voice, and digital modes. Multipliers continue to count once.
- A minor change in the minimum break time may give some school operations some additional operating time. The minimum break time has been reduced from 30 minutes to 10 minutes. This may be helpful for schools where operation is interrupted by the changing of classes.
The twice-yearly event is an opportunity for school club stations — from elementary school to college — to enjoy some friendly radio activity. Sponsored by the ARRL, the ARRL Hudson Division Education Task Force, and the Long Island Mobile Amateur Radio Club (LIMARC), the contest aims to foster contacts with and among school radio clubs.
Participation in the School Club Roundup is easy, and there’s a club category for everyone: Elementary/Primary, Middle/Intermediate/Junior High School, Senior High School, College/University Club, and Non-School Club. There is also an Individual category.
Stations exchange signal reports, class (“Individual”, “Club,” or “School”), and US state, Canadian province/territory, or DXCC entity. Stations may operate on all amateur bands except 60, 30, 17 and 12 meters (no repeater contacts and VHF/UHF contacts must be on recognized simplex frequencies, except calling frequencies). Stations may operate phone, CW, and digital modes, or a combination. The most popular time for younger students is during the after-school hours, but older students may be on the air anytime. All groups are limited to one transmitter on the air. Stations may operate no more than 6 hours in any 24-hour period (up to a maximum of 24 hours).
If you just want to get on the air and hand out contacts, enter in the Individual category. Tune around in any mode and listen for SCR stations calling CQ, or call CQ yourself and see who answers. Call “CQ School Clubs” or “CQ SCR” on CW, if you aren’t a club station. After the contest is over, submit your log online (preferred) or by paper.
Logs are due no more than 15 days after the operating period end and can be submitted online via the WA7BNM website. Claimed scores are displayed and the logs are reviewed by LIMARC before final results are posted. The top three entries in each category — Elementary, Middle/Intermediate/Junior High School, Senior High School College/University — will receive an Award Certificate. Non-school clubs or multiop groups and individuals are also eligible for certificates.
See “Getting Organized for School Club Roundup” for some helpful tips! Stay up to date on SCR by subscribing to the School Club Roundup reflector.
Saturday, August 11, 2012
2012 Perseid Meteor Shower Peaks Tonight August 11
The annual Perseid meteor shower peaks
tonight into early Sunday morning and if the sky above you is clear you
are sure to enjoy a spectacular astronomical show. While the meteors
are the main billing tonight, there are a few other players on the
stellar stage. Look to the east early tomorrow morning before dawn as
Jupiter, then the moon and finally Venus will rise, creating a nice
diagonal line.  Of course with any of these events in the sky the weather is the most
important variable. It won't matter how great the meteors are if it's
overcast. Much of Texas, the Ohio Valley, Tennessee, the northern parts
of Alabama, Mississippi and the Rockies look to have favorable sky
conditions. parts of Florida and a good deal of the West Coast will
also be mainly clear.
Of course with any of these events in the sky the weather is the most
important variable. It won't matter how great the meteors are if it's
overcast. Much of Texas, the Ohio Valley, Tennessee, the northern parts
of Alabama, Mississippi and the Rockies look to have favorable sky
conditions. parts of Florida and a good deal of the West Coast will
also be mainly clear.
I'd love to hear your thoughts on this blog or any others. If you have a weather or gardening question ask me on Twitter at @growingwisdom and be sure to tell me where you are located.
Looking at the latest satellite photo
shows us where the clouds are now and will help forecast where they
will be overnight for the show. The satellite image below will change as
it gets dark later tonight. However, if you notice clouds now there is
a good chance you will miss the show, but some types of cumulus clouds
melt away with the setting sun. I circled areas most likely to see or
partially see the meteors. Truthfully, you really need clear skies to be
wowed. You can catch a few in the fair to good area if you are lucky,
but it's much more difficult. Also, head to the darkest place you can
find. Light pollution is a killer for these events. Of course with any of these events in the sky the weather is the most
important variable. It won't matter how great the meteors are if it's
overcast. Much of Texas, the Ohio Valley, Tennessee, the northern parts
of Alabama, Mississippi and the Rockies look to have favorable sky
conditions. parts of Florida and a good deal of the West Coast will
also be mainly clear.
Of course with any of these events in the sky the weather is the most
important variable. It won't matter how great the meteors are if it's
overcast. Much of Texas, the Ohio Valley, Tennessee, the northern parts
of Alabama, Mississippi and the Rockies look to have favorable sky
conditions. parts of Florida and a good deal of the West Coast will
also be mainly clear. I'd love to hear your thoughts on this blog or any others. If you have a weather or gardening question ask me on Twitter at @growingwisdom and be sure to tell me where you are located.
Overnight clouds
If you live where it is expected to be cloudy, like here in the northeast, it is still worth looking up later tonight. Last evening we had big thunderstorms in the area but early this morning it cleared enough to see some of the meteors in the Massachusetts area. The same thing could very easily happen across the northeast later tonight.
This image gives a good idea of who will have clouds and who won't tonight. Remember, be patient as clouds move and while it can be cloudy for few minutes, you only need a short window to have a memorable experience. This map is based on a computer model. I recommend using both maps and your own common sense before venturing outside.
What to expect
Give your eyes about 10 minutes to adjust to the dark. If you are watching the show with kids you can have them try to find a satellite while waiting for a meteor. Satellites are quite easy to spot as they look like shooting stars but move across the sky at a much slower speeds. It can take a minute or more for a satellite to cross your field of view. I use the opportunity to talk about the earth, orbits and other planets to children during these events. Tonight you can expect about 25-60 meteors per hour. You won't see the meteors evenly spread out over time. You may see nothing for five minutes and then four or more in a row a minute later. Lie on a blanket and look up rather than stand. If you stand with your neck tilted up, you will have neck issues in the morning. On Sunday night, heading into the morning of the 13th there will be fewer meteors per hour, but still a nice show. The best time to see this will be around 2AM-3AM, but if you don't want to wait till then it's still worthwhile at early at 10PM to 11PM. The planetary show I wrote about early is around for the next week. I think in some ways that is even a better show because if it's clear, you see it, no waiting!
Smarthphone and social media meteor shower
NASA wants your help in counting the number of meteors. You can download an app "Meteor Counter" for free in the Android Marketplace and Apple's App Store and then report the data. You can even "Tweet" your findings using the hashtag symbol # and the keyword perseids.

Thursday, April 14, 2011
Coolest March globally since 1994

 <–click on the graphics to enlarge or click here for the first graphic and click here for the 2nd graphic. Global temperatures were colder in March 2011 than in any March since 1994. The Northern Hemisphere, the Southern Hemisphere and the Tropics all had colder than average temperatures in March. Temperature differences in March from average: Muskegon -0.8°, Grand Rapids -0.9°, Holland -1.1°, Battle Creek -1.2°, Lansing -1.3°, Kalamazoo -1.5°, Ann Arbor -2.8°, Ludington -3.4°, Houghton Lake -3.7° (Houghton Lake had a continuous snow cover of 2″ or more from Dec. 8th through April 9th or 123 days), Gaylord -5.0° and Manistee -5.5°. Global temperatures have been dropping since June 2010 in response to the La Nina/cold PDO. Here’s the North Pole icecap graph. The graph shows that current ice is closer to the April average than the low year of 2007 and that the melt has barely begun this year. In fact, Barrow Alaska had a high of 2 above zero on Tuesday, which was the warmest day of the month so far. It’s hard to melt ice with temperatures like that. Bettles, Alaska had a record low temperature of -20 Tuesday morning. They are -6.5 below average for April so far. Kotzebue, Alaska still has 62″ of snow on the ground! Here’s the current North American snow cover. Canada is still about 85% snow covered and there is above average snow on the ground in the higher elevations of both the Western mountains and New England. The town of Resolute, Canada reports that the average temperature for April so far has been -21°F and the average temperature at the town of Alert has been -23.8°F. It’s hard to melt ice with temperatures like that. One more thing…check out the latest global sea surface temperature anomalies. You can see the cold PDO (cold water in the shape of a backwards “C” off the West Coast of the U.S., the weakening La Nina (warmer water developing along the Equator west of S. America), the warm AMO (warm water in the shape of a backwards “C”) in the Atlantic Ocean), the warm water in the Gulf of Mexico (which will lead to more severe weather this spring from southern Michigan to the northern Gulf States and also to an increased number of hurricanes his late summer/fall – which is typical for La Nina).
Thursday, March 24, 2011
Wednesday, March 23, 2011
Radio Amateurs in Japan Still Providing Communications Support
03/23/2011
On the afternoon of Friday, March 11, an 8.9 earthquake hit Northern Japan, followed by several big aftershocks and a devastating tsunami in the coastal areas. “In the early stage following the earthquake and tsunami, several radio amateurs were able to activate their stations with car batteries or small engine generators, despite the electric power outages,” IARU Region 3 Secretary Ken Yamamoto, JA1CJP, told the ARRL. “They transmitted rescue requests and information on the disaster situation -- including refugee centers and their needs -- and the availability of basic infrastructures, such as electricity, water and gas supplies.” After the earthquake and tsunami, there were no electricity, water or gas services in many of the affected areas.
 In his report to the ARRL, Yamamoto said that the Japan Amateur Radio League (JARL) activated JA1RL, its headquarters station in Tokyo. With the help of many other amateurs, it also activated its regional headquarters station JA3RL in Osaka to communicate with the amateurs in the damaged areas, including its Tohoku headquarters station JA7RL in Sendai. “The communications were mostly on the 7 MHz band in daytime and the 3.5 MHz band at night,” Yamamoto explained. “Short range communications were also made on the 144 and 430 MHz bands. The information gathered through Amateur Radio communications was reported to the rescue and disaster relief organizations for their appropriate deployment. Some other amateurs accepted health-and-welfare inquiries from the suffered areas and the posted the information on the Internet.”
Japan’s Ministry of Internal Affairs and Communications -- that country’s equivalent of the FCC -- approved an additional 300 UHF/VHF transceivers to be used in the affected areas.
In the disaster area, many gas stations were also washed away; Yamamoto said that the fuel shortage was “a very serious problem in the cold climate. Calls for fuel were received over radio from many disaster areas, but delivery remained very difficult at least for the first week as the access roads were hacked up everywhere. Several days later, some Amateur Radio clubs reached the affected areas with their radio equipment and established communications for supporting disaster relief.”
Yamamoto told the ARRL that several radio equipment manufacturers offered “hundreds of VHF/UHF transceivers to JARL for the use at refugee centers and local disaster relief centers. These transceivers should help to establish mutual communications between refugee and disaster relief centers, and to facilitate smooth and appropriate delivery of disaster relief goods.”
As of noon JST on March 23 (0300 UTC), Japanese authorities announced that 9408 people have been killed and another 14,716 people have been reported missing due to the earthquake and tsunami.
via ARRL.net
Saturday, March 19, 2011
Hams Invited to Track Satellites
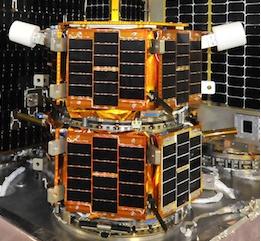
In November 2010, five research satellites were carried to orbit aboard a Minotaur V rocket from Kodiak Island, Alaska. Two of these satellites -- FASTRAC 1, known as “Sara Lily” and FASTRAC 2, referred to as “Emma” -- entered orbit as a single nanosatellite, but on March 15, scientists sent the command to have them separate. According to FASTRAC Student Program Manager Sebastian Munoz, KE5FKV, students at the University of Texas will be confirming the separation as the satellites pass: “We started one of the most exciting phases of our project by separating both of our girls so that they can compute on-orbit real-time relative navigation solutions while both of them are freely drifting from one another.” Munoz said that they will continue to update the satellites’ two line elements (TLEs) on their website for those radio amateurs interested in tracking the two nanosatellites. “I want to thank the ham community all over the world for supporting our project,” Munoz said. “Your support has been incredible and we really value it. We really appreciate all of your help so far and we hope that we can continue to count on it.”
 via arrl.org
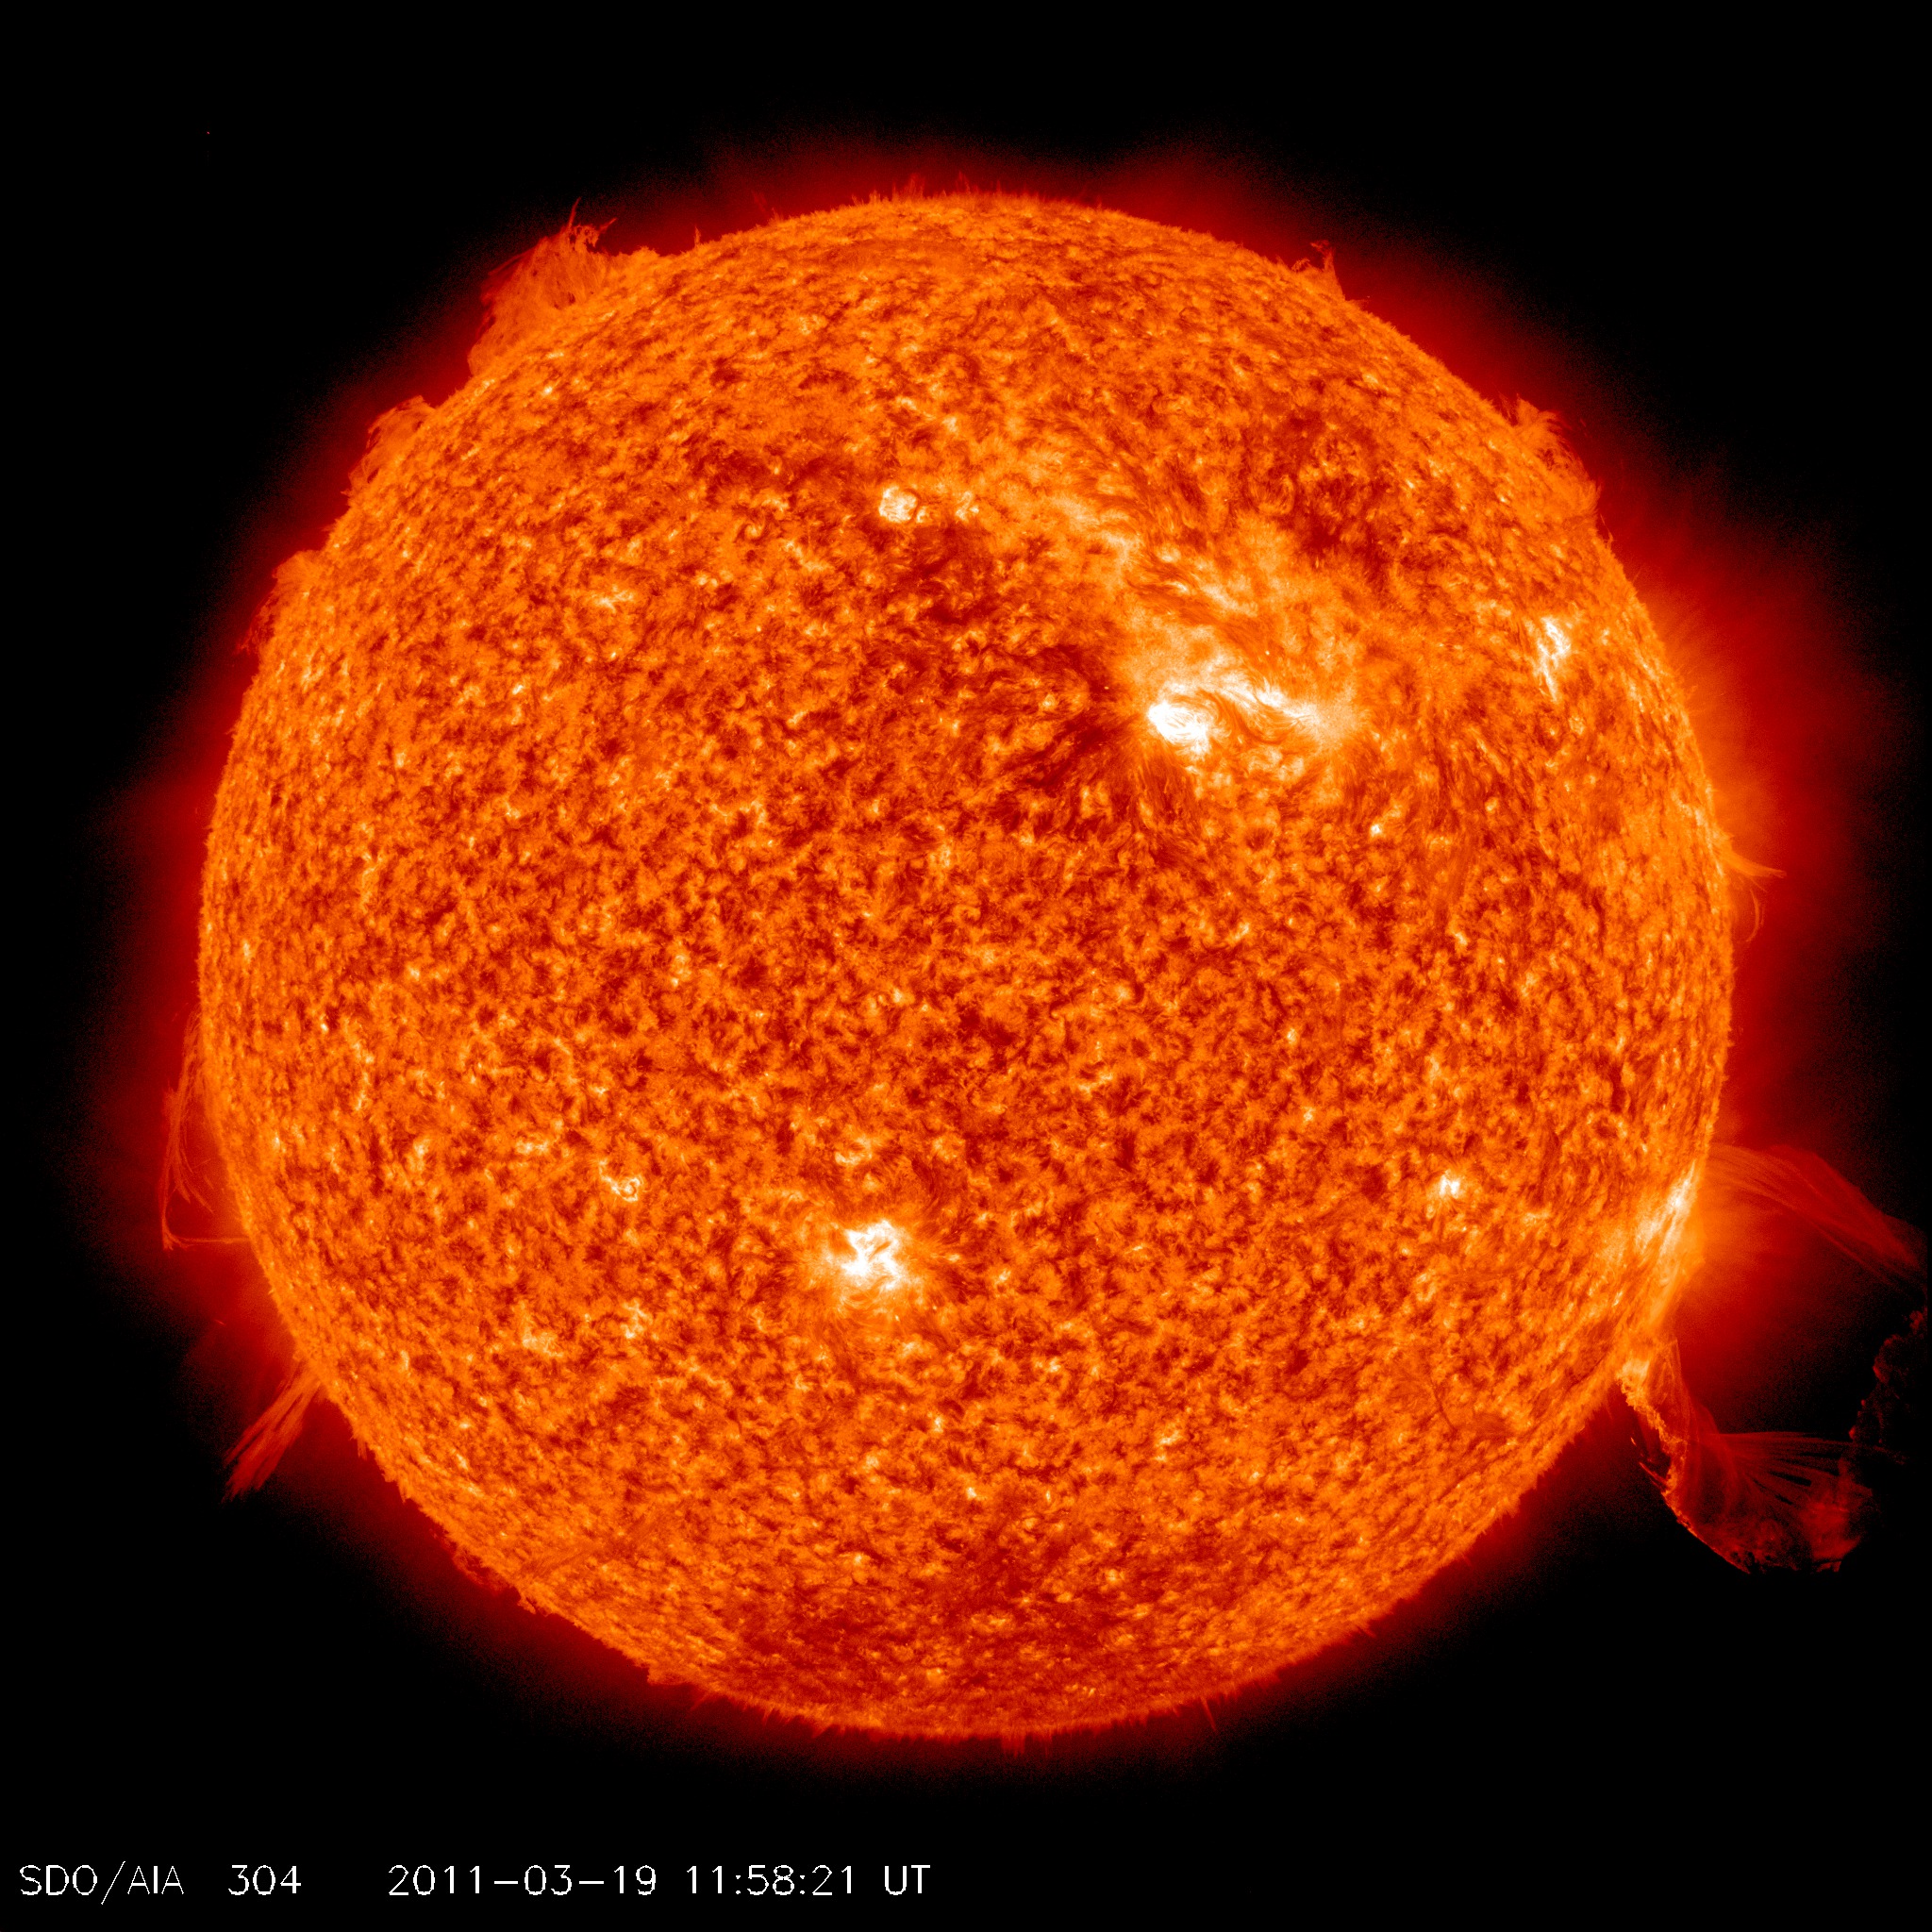
SOLAR ICONIC ERUPTION
A huge filament of magnetism and hot plasma blasted off the sun's southwestern limb today, March 19th, at around 1200 UT. The eruption was not Earth-directed, but it was iconic. Just look at this snapshot recorded by NASA's Solar Dynamics Observatory:
Many amateur astronomers in Europe witnessed the blast and said it was the biggest one they'd ever seen. This event continues the recent trend of increasing solar activity, and shows anew that Solar Cycle 24 is gaining steam after a long period of relative quiet.
Many amateur astronomers in Europe witnessed the blast and said it was the biggest one they'd ever seen. This event continues the recent trend of increasing solar activity, and shows anew that Solar Cycle 24 is gaining steam after a long period of relative quiet.
Super Moon March 19 2011
Clearly there's a lot of confusion about what's really a SuperMoon. I know, because I created and defined the term in an article published over 30 years ago. When I see people misrepresenting the idea, not really understanding it at all, I feel impelled - not compelled - to try and set the record straight. Words mean things, after all . . . For example, referring to the date of the last SuperMoon as 18 years ago - as several media reports are doing lately - is completely wrong. There are 4-6 SuperMoons a year on average. The one on March 19, 2011 is in fact the closest SuperMoon of the year, but it's not by any means the first one in 18 years, nor even the first extreme SuperMoon in 18 years. The truth is, March 19 will be the second SuperMoon this year, and we only have to go back to January 30, 2010 to find the last example of an extreme SuperMoon; as revealed in my tables published in the last century. There was a SuperMoon in effect February 12-21 this year in fact, which anyone who actually read my 2011 World Forecast Highlights would know. And I'm sure you're aware of the Christchurch earthquake that practically destroyed that city on the last day of that interval. (All my forecasts are in UT, which equates to February 22, 2011 New Zealand time. The Christchurch earthquake is now being called the worst in New Zealand history, a title formerly held by the Hawkes Bay earthquake of February 3, 1931 - another SuperMoon, in case you're keeping count.) I've done a few interviews on this subject already, for example on the Red Symons ABC Radio program in Melbourne, Australia; and in each and every case the contact was due to other sources writing about "supermoon" effects which do not fit within the parameters as I defined them more than three decades ago. Clearly, it's time to set the record straight. (This is a work in progress, in fact just the stub of an article I'm writing to clear up all the confusion - so check back often to get the whole story.)
SuperMoon is a word I coined in a 1979 article for Dell Publishing Company's HOROSCOPE magazine, describing a new or full moon which occurs with the Moon at or near (within 90% of) its closest approach to Earth in a given orbit. In short, Earth, Moon and Sun are all in a line, with Moon in its nearest approach to Earth. At any new or full moon, Earth and Moon and Sun are all in a line: Earth is in the middle in the full moon alignment, while the new moon happens with Moon in the middle. This coming together in an alignment is technically termed a syzygy. Sometimes - from a few times to a half-dozen times in a given year - these alignments also happen when the Moon is in its perigee, or closest approach to Earth. Astronomers call this very special alignment a perigee-syzygy. I call it a SuperMoon – which is a whole lot easier on the tongue. (My most recent print article on this subject appeared in the October-November 2007 issue of The Mountain Astrologer.)
SuperMoons are noteworthy for their close association with extreme tidal forces working in what astrologers of old used to call the sublunary world: the atmosphere, crust and oceans of our home planet - including ourselves, of course. From extreme coastal tides to severe storms to powerful earthquakes and volcanic eruptions, the entire natural world surges and spasms under the sway of the SuperMoon alignment - within three days either way of the exact syzygy, as a general rule. SuperMoon solar eclipses tend to have a wider sphere of impact, extending roughly a week before and after the actual event. And other lunar extremes (of declination, for example) can extend the geocosmic stress window by a day or two here and there in any case.
If you're interested in the history of SuperMoon alignments in connection with great storms, earthquakes and volcanic eruptions, you'll find a sampling of them in my book Interpreting Astrology (published by the American Federation of Astrologers). But a simple review of the news over the past few years should serve to get you acquainted. Take Hurricane Katrina, for example; spawned from a tropical depression formed within three days of the August 19 SuperMoon. My forecast for 2005 warned of severe storms within plus or minus three days of the day Hurricane Katrina formed, and even specified the Gulf of Mexico as one of the areas at risk in connection with that particular SuperMoon alignment. I've done this for over thirty years now, from articles in the astrology press to the online forecasts at my website, astropro. You can play along at home, using my handy tables of all 20th and 21st Century SuperMoon alignments. (You might even find that you were born under a SuperMoon.)
Examples of the SuperMoon connection with major storms and seismic events abound: the Mt. Pinatubo eruption, the largest volcanic event in the second half of the 20th Century, took place on June 15, 1991 (within three days of a SuperMoon); the October 6, 1948 Richter 7.3 earthquake that struck Ashgabat, Turkmenistan and took 110,000 lives, one of the deadliest earthquakes on record (again within three days of a SuperMoon, allowing for time zones); and the September 8, 1900 hurricane and tidal surge that struck Galveston, Texas on the day of a SuperMoon, which killed more people (8,000 dead) than any other Atlantic hurricane on record and remains the deadliest natural disaster yet to strike the United States. I'm just scratching the surface here, citing only a few historic instances in the past hundred years or so. Look a little deeper, and you'll run across literally hundreds more greater and lesser seismic and meteorological disturbances, from Hurricane Andrew in 1992 to the 1989 World Series (Loma Prieta) earthquake - just to name a couple contemporary notable examples.
More recently, there was the February 28, 2010 SuperMoon, which well illustrates the storm and seismic potential associated with this alignment. As described in my 2010 World Forecast Highlights, the geocosmic shock window associated with the February 28 SuperMoon ran "from February 25 through March 3," signaling a "newsworthy upsurge in moderate-to-severe seismic activity (including magnitude 5+ earthquakes and volcanic eruptions), plus strong storms with damaging winds and heavy precipitation; along with extreme high tides." My forecast described the alignment as "global in scope by definition," but with "special risk zones" including "west-central South America." If you don’t remember it, Google the freakish combination of a monster megathrust 8.8-magnitude earthquake in Chile, a Pacific tsunami, the “snow hurricane” in the Northeastern US, and hurricane-force killer winds in France - all happening at once on February 27.
Obviously it won't be the case that all hell will break loose all over the world within a few days either side of the SuperMoons of 2011. For most of us, the geocosmic risk raised by SuperMoon alignments will pass with little notice in our immediate vicinity. In the grand scheme of things, we may live on a little blue marble in space; but it’s still a rather roomy planet, after all. A SuperMoon is planetary in scale, being a special alignment of Earth, Sun and Moon. By the same token, it’s planetary in scope, in the sense that there's no place on Earth not subject to the tidal force of the perigee-syzygy. Of course, earthquakes and volcanic eruptions don't go wandering all over the planet. They happen in (mostly) predictable locations, like the infamous "Ring of Fire" around the Pacific plate. If you're in (or plan to be in) a place that's subject to seismic upheaval during a SuperMoon stress window, it's not hard to figure out that being prepared to the extent that you can is not a bad idea. Likewise, people on the coast should be prepared for extreme tidal surges. Severe storms on the other hand can strike just about anywhere, so it behooves us all to be ready for rough weather when a SuperMoon alignment forms. Astro-locality mapping each SuperMoon can help indicate areas of special risk, but the whole planet is in the bull’s eye when one of these geocosmic shock windows opens up. Don’t be paranoid – but don’t be complacent, either.
That said, there's no harm in making sensible preparations for this year’s SuperMoons. The worst that can happen, if the worst doesn't happen, is that you end up with a stock of fresh batteries and candles, some extra bottled water and canned goods, maybe a full tank of gas and an evacuation bag packed just in case. (The US Department of Homeland Security has a detailed evacuation kit inventory that, to quote them, "could mean the difference between life and death".) And maybe you'll think twice about being in transit and vulnerable to the weather hazards and delays that are so common during SuperMoon alignments. These are the kind of sensible precautions that can make a big difference if the worst does come to pass. It certainly will come to pass somewhere – hopefully far from you and me, but we can’t be sure of that.
If what you just read doesn’t sound anything like what you’ve been told to expect from a SuperMoon alignment, it’s because a great many people have played fast and loose with the term. I created it, I defined it, I should know. Don’t get me wrong, I’m far from the first person in history to notice the connection between lunar perigee-syzygy and powerful tides stirring up Earth’s atmosphere, crust and oceans.
Lunar perigee-syzygy was first brought to my attention in 1978, when I read Fergus Wood's Strategic Role of Perigean Spring Tides. Wood's treatise concentrates on the tide-raising power of perigee-syzygy, but upon reading it and digging into a bit of history, I quickly became convinced that this is a phenomenon of far more than tidal significance. And I also discovered that ancient astrologers and astronomers were not totally oblivious to the phenomenon. In the 2nd Century BCE, Hipparchus had noticed that the Moon appears larger at certain times of the lunar month, and reasoned that this was due to Luna being closer to Earth at such times - perigee, of course. A few hundred years later, Ptolemy focused on soli-lunar syzygies as keys to the cosmic equation: "There are certain particular consequences which result from the New and Full Moon." From Hippparchus pointing to lunar perigee and Ptolemy recognizing the importance of soli-lunar syzygy, it's a small step to putting the two together - and what you get is SuperMoon.
How much bigger does a SuperMoon full moon look, compared to a full moon that occurs with Luna at apogee (the most distant point from Earth in the Moon’s orbit)? Some critics have charged that you can’t tell the difference, which is just plain silly. A very close estimate of the difference in apparent size can be obtained from the ratio of the full moon’s distance at perigee, divided by the full moon’s distance at apogee. (The result from this method actually agrees to within less than one percent of the actual difference in apparent size as measured in pixels with a CCD.) Take for example the March 19, 2011 SuperMoon, at 356,577 km. away. Compare that to the 406,434 km. distance of the apogee full moon on October 12, 2011: 406,434/356,577 = 1.1398. This puts the Moon 13% (49,857 km.) closer to Earth on the March 19 SuperMoon than it is on the October 12, 2011 full moon. The intensity of light being the inverse square of the distance between a light source and an observer, squaring this ratio tells us how much brighter the March 19 SuperMoon appears in comparison to the October 12 apogee full moon: 1.1398^2 = 1.299, or 30% brighter.
While we’re on the subject of math, I’ve had questions from people who claim that my definition of SuperMoon is nonsensical because "the Earth-Moon distance is *always* "90% or greater of its mean closest approach". Sometimes, what appears to be nonsensical only seems so, because it's not understood. You could figure this out for yourself with a calculator, if you were so inclined. (They say it's better to light a candle than to curse the darkness, after all.) Maybe I can help.
Start with my table of lunar apogees and perigees for 2011. Notice the year's extreme apogee (406,655 km. on APR 2) and extreme perigee (356,577 on MAR 19). The difference is 50,078 km., and 90% of that difference is 45,070 km. Any syzygy which is closer than 406,655 km. - 45,070 km. = 361,585 km. qualifies as a SuperMoon, being at least 90% of the way to the closest Earth-Moon separation. Or use mean values, as given at Wikipedia: mean apogee 406,731 km. - mean perigee 364,397 km. = 42,334 km. * .9 = 38,101 km.; 406,731 km. - 38,101 km. = 368,630 km.; any lunation closer than 368,630 km. = SuperMoon.
 Clearly, the Moon cannot be *always* at 90% or greater its closest mean approach, if in some cases it is less than 90% of that distance. Again, calculator time: the Moon on APR 2, being 50,078 km. farther than its closest approach to Earth of the year, is at 0% of that closest distance; while the Moon on MAR 19 is at 100% of that closest approach. (Seriously, so many of these critics are really only interested in criticizing - which they do without first bothering to know what they're talking about. But that's just the way skeptics are.)
by Richard Nolle
SuperMoon is a word I coined in a 1979 article for Dell Publishing Company's HOROSCOPE magazine, describing a new or full moon which occurs with the Moon at or near (within 90% of) its closest approach to Earth in a given orbit. In short, Earth, Moon and Sun are all in a line, with Moon in its nearest approach to Earth. At any new or full moon, Earth and Moon and Sun are all in a line: Earth is in the middle in the full moon alignment, while the new moon happens with Moon in the middle. This coming together in an alignment is technically termed a syzygy. Sometimes - from a few times to a half-dozen times in a given year - these alignments also happen when the Moon is in its perigee, or closest approach to Earth. Astronomers call this very special alignment a perigee-syzygy. I call it a SuperMoon – which is a whole lot easier on the tongue. (My most recent print article on this subject appeared in the October-November 2007 issue of The Mountain Astrologer.)
SuperMoons are noteworthy for their close association with extreme tidal forces working in what astrologers of old used to call the sublunary world: the atmosphere, crust and oceans of our home planet - including ourselves, of course. From extreme coastal tides to severe storms to powerful earthquakes and volcanic eruptions, the entire natural world surges and spasms under the sway of the SuperMoon alignment - within three days either way of the exact syzygy, as a general rule. SuperMoon solar eclipses tend to have a wider sphere of impact, extending roughly a week before and after the actual event. And other lunar extremes (of declination, for example) can extend the geocosmic stress window by a day or two here and there in any case.
If you're interested in the history of SuperMoon alignments in connection with great storms, earthquakes and volcanic eruptions, you'll find a sampling of them in my book Interpreting Astrology (published by the American Federation of Astrologers). But a simple review of the news over the past few years should serve to get you acquainted. Take Hurricane Katrina, for example; spawned from a tropical depression formed within three days of the August 19 SuperMoon. My forecast for 2005 warned of severe storms within plus or minus three days of the day Hurricane Katrina formed, and even specified the Gulf of Mexico as one of the areas at risk in connection with that particular SuperMoon alignment. I've done this for over thirty years now, from articles in the astrology press to the online forecasts at my website, astropro. You can play along at home, using my handy tables of all 20th and 21st Century SuperMoon alignments. (You might even find that you were born under a SuperMoon.)
Examples of the SuperMoon connection with major storms and seismic events abound: the Mt. Pinatubo eruption, the largest volcanic event in the second half of the 20th Century, took place on June 15, 1991 (within three days of a SuperMoon); the October 6, 1948 Richter 7.3 earthquake that struck Ashgabat, Turkmenistan and took 110,000 lives, one of the deadliest earthquakes on record (again within three days of a SuperMoon, allowing for time zones); and the September 8, 1900 hurricane and tidal surge that struck Galveston, Texas on the day of a SuperMoon, which killed more people (8,000 dead) than any other Atlantic hurricane on record and remains the deadliest natural disaster yet to strike the United States. I'm just scratching the surface here, citing only a few historic instances in the past hundred years or so. Look a little deeper, and you'll run across literally hundreds more greater and lesser seismic and meteorological disturbances, from Hurricane Andrew in 1992 to the 1989 World Series (Loma Prieta) earthquake - just to name a couple contemporary notable examples.
More recently, there was the February 28, 2010 SuperMoon, which well illustrates the storm and seismic potential associated with this alignment. As described in my 2010 World Forecast Highlights, the geocosmic shock window associated with the February 28 SuperMoon ran "from February 25 through March 3," signaling a "newsworthy upsurge in moderate-to-severe seismic activity (including magnitude 5+ earthquakes and volcanic eruptions), plus strong storms with damaging winds and heavy precipitation; along with extreme high tides." My forecast described the alignment as "global in scope by definition," but with "special risk zones" including "west-central South America." If you don’t remember it, Google the freakish combination of a monster megathrust 8.8-magnitude earthquake in Chile, a Pacific tsunami, the “snow hurricane” in the Northeastern US, and hurricane-force killer winds in France - all happening at once on February 27.
Obviously it won't be the case that all hell will break loose all over the world within a few days either side of the SuperMoons of 2011. For most of us, the geocosmic risk raised by SuperMoon alignments will pass with little notice in our immediate vicinity. In the grand scheme of things, we may live on a little blue marble in space; but it’s still a rather roomy planet, after all. A SuperMoon is planetary in scale, being a special alignment of Earth, Sun and Moon. By the same token, it’s planetary in scope, in the sense that there's no place on Earth not subject to the tidal force of the perigee-syzygy. Of course, earthquakes and volcanic eruptions don't go wandering all over the planet. They happen in (mostly) predictable locations, like the infamous "Ring of Fire" around the Pacific plate. If you're in (or plan to be in) a place that's subject to seismic upheaval during a SuperMoon stress window, it's not hard to figure out that being prepared to the extent that you can is not a bad idea. Likewise, people on the coast should be prepared for extreme tidal surges. Severe storms on the other hand can strike just about anywhere, so it behooves us all to be ready for rough weather when a SuperMoon alignment forms. Astro-locality mapping each SuperMoon can help indicate areas of special risk, but the whole planet is in the bull’s eye when one of these geocosmic shock windows opens up. Don’t be paranoid – but don’t be complacent, either.
That said, there's no harm in making sensible preparations for this year’s SuperMoons. The worst that can happen, if the worst doesn't happen, is that you end up with a stock of fresh batteries and candles, some extra bottled water and canned goods, maybe a full tank of gas and an evacuation bag packed just in case. (The US Department of Homeland Security has a detailed evacuation kit inventory that, to quote them, "could mean the difference between life and death".) And maybe you'll think twice about being in transit and vulnerable to the weather hazards and delays that are so common during SuperMoon alignments. These are the kind of sensible precautions that can make a big difference if the worst does come to pass. It certainly will come to pass somewhere – hopefully far from you and me, but we can’t be sure of that.
If what you just read doesn’t sound anything like what you’ve been told to expect from a SuperMoon alignment, it’s because a great many people have played fast and loose with the term. I created it, I defined it, I should know. Don’t get me wrong, I’m far from the first person in history to notice the connection between lunar perigee-syzygy and powerful tides stirring up Earth’s atmosphere, crust and oceans.
Lunar perigee-syzygy was first brought to my attention in 1978, when I read Fergus Wood's Strategic Role of Perigean Spring Tides. Wood's treatise concentrates on the tide-raising power of perigee-syzygy, but upon reading it and digging into a bit of history, I quickly became convinced that this is a phenomenon of far more than tidal significance. And I also discovered that ancient astrologers and astronomers were not totally oblivious to the phenomenon. In the 2nd Century BCE, Hipparchus had noticed that the Moon appears larger at certain times of the lunar month, and reasoned that this was due to Luna being closer to Earth at such times - perigee, of course. A few hundred years later, Ptolemy focused on soli-lunar syzygies as keys to the cosmic equation: "There are certain particular consequences which result from the New and Full Moon." From Hippparchus pointing to lunar perigee and Ptolemy recognizing the importance of soli-lunar syzygy, it's a small step to putting the two together - and what you get is SuperMoon.
How much bigger does a SuperMoon full moon look, compared to a full moon that occurs with Luna at apogee (the most distant point from Earth in the Moon’s orbit)? Some critics have charged that you can’t tell the difference, which is just plain silly. A very close estimate of the difference in apparent size can be obtained from the ratio of the full moon’s distance at perigee, divided by the full moon’s distance at apogee. (The result from this method actually agrees to within less than one percent of the actual difference in apparent size as measured in pixels with a CCD.) Take for example the March 19, 2011 SuperMoon, at 356,577 km. away. Compare that to the 406,434 km. distance of the apogee full moon on October 12, 2011: 406,434/356,577 = 1.1398. This puts the Moon 13% (49,857 km.) closer to Earth on the March 19 SuperMoon than it is on the October 12, 2011 full moon. The intensity of light being the inverse square of the distance between a light source and an observer, squaring this ratio tells us how much brighter the March 19 SuperMoon appears in comparison to the October 12 apogee full moon: 1.1398^2 = 1.299, or 30% brighter.
While we’re on the subject of math, I’ve had questions from people who claim that my definition of SuperMoon is nonsensical because "the Earth-Moon distance is *always* "90% or greater of its mean closest approach". Sometimes, what appears to be nonsensical only seems so, because it's not understood. You could figure this out for yourself with a calculator, if you were so inclined. (They say it's better to light a candle than to curse the darkness, after all.) Maybe I can help.
Start with my table of lunar apogees and perigees for 2011. Notice the year's extreme apogee (406,655 km. on APR 2) and extreme perigee (356,577 on MAR 19). The difference is 50,078 km., and 90% of that difference is 45,070 km. Any syzygy which is closer than 406,655 km. - 45,070 km. = 361,585 km. qualifies as a SuperMoon, being at least 90% of the way to the closest Earth-Moon separation. Or use mean values, as given at Wikipedia: mean apogee 406,731 km. - mean perigee 364,397 km. = 42,334 km. * .9 = 38,101 km.; 406,731 km. - 38,101 km. = 368,630 km.; any lunation closer than 368,630 km. = SuperMoon.

by Richard Nolle
Friday, March 18, 2011
K7RA SOLAR UPDATE
03/18/2011
The average daily sunspot numbers this week plummeted 45 points to 69, while the average daily solar flux was off over 26 points to 113.1. Sunspot numbers for March 10-16 were 88, 105, 78, 64, 51, 47 and 50, with a mean of 69. The 10.7 cm flux was 131.3, 123.1, 120.7, 112.9, 107.4, 101.5 and 95, with a mean of 113.1. The estimated planetary A indices were 20, 40, 13, 6, 6, 0 and 0, with a mean of 12.1. The estimated mid-latitude A indices were 14, 18, 10, 5, 2, 0, and 1 with a mean of 7.1.
In a brief report for this week’s ARRL Letter, we said that average flux was off nearly 25 points to 114.5. The average changed because the observatory in Penticton reported the solar flux for Wednesday, March 16 as 104.9, but later it was adjusted down to 95 by NOAA’s Space Weather Prediction Center. This happens sometimes when energy from a Coronal Mass Ejection overwhelms the 2.8 GHz (10.7 cm wavelength) receiver at the Dominion Radio Astrophysical Observatory in Penticton, British Columbia. A good example was on March 7, 2011 when the noon solar flux reading was 938.6. This was an obvious outlier, caused by a solar flare out of sunspot group 1166 that was positioned near optimal geoeffectiveness. As a result, the official number was adjusted down to 122. But Wednesday’s number didn’t seem so obviously out of line, and the timing didn’t seem to line up with the only event I knew of, an eruption from sunspot group 1169, which was nearly over the solar horizon.
When I saw an image showing the CME on the western limb with a time stamp of 2048, I assumed this meant the event occurred 48 minutes after the 2000 flux reading. But it turned out to be a long duration event.
Rob Steenburgh, KA8JBY, works at the Space Weather Prediction Center in Boulder, and looked into this for us. He checked with the forecasters, who wrote: “The Penticton noon flux did come at 105, but was flare-enhanced. We estimated a value of 95 based on the morning flux. The long duration event (LDE) began at 16/1752, max at 16/2034 and end at 16/2324. It peaked at C3.7 from Region 1169 (N18W75). The Penticton noon reading is taken between the hours of 1900-2000, so it was right in the middle of the LDE. It was an extremely impressive looking event on GOES-15 SXI.”
So I didn’t realize that the noon reading was actually taken over the course of the hour before noon, not just a snapshot right at local noon (2000). Rob clarified this and said that there are four readings taken over the hour. One is ignored (the outlier, or the one most different from the other three), while the rest are averaged to produce the noon solar flux. So that estimate for Wednesday was 95 and the measured value for Thursday was 90.1, which seems consistent with the declining sunspot numbers for Wednesday and Thursday -- 50 and 45 -- and the shrinkage of total sunspot area, 300 and 170 millionths of a solar hemisphere.
Last Friday, March 11, the planetary A index reached 40 due to a powerful X1.5 class solar flare at 2323 on March 9. This is another definite indication that Solar Cycle 24 is ramping up. After four years of no X class flares, there have been two in the last month.
The past few days have seen very quiet geomagnetic conditions, with the K index in most locations at 0. The latest forecast shows quiet conditions with planetary A index around 5 until March 27-30, when the predicted planetary A index is expected to rise to 7, 7, 19 and 7. Geophysical Institute Prague predicts quiet conditions March 18-19, unsettled March 20, quiet to unsettled March 21, unsettled March 22, quiet to unsettled March 23 and quiet on March 24. The predicted solar flux for March 18-25 is 85, 80, 85, 90, 95, 100, 105, 110 and the 85 for March 26-29.
This Sunday is the spring equinox in the northern hemisphere, a welcome sign for DXers everywhere, when both the northern and southern hemispheres are bathed in an equal amount of solar radiation.
In the bulletin preview yesterday, we promised to explain how the geomagnetic A index for the day is calculated using the eight K index values throughout the day. Here is how it works:
The K index value is not linear; it is based on magnetic measurements in units called nano-Teslas. K index of 0 corresponds to a three-hour measurement of 0-5 nT, 1 is >5 nT, K of 2 is >10, 3 is >20, 4 >40, 5 >70, 6 >120, 7 >200, 8 >339 and 9 is >500 nT. The idea of the A index is to take an average of the K index to express a value for the whole day, but because the K index is not a linear scale, so it is not realistic to just average the eight K index measurements. Instead, we convert each K index into a linear scale -- called the A index -- then average those and that yields the A index value for the day, which is always expressed in whole numbers. The equivalent A values for each K value are, K of 1 is 3, 2 is 7, 3 is 15, 4 is 27, 5 is 48, 6 is 80, 7 is 140, 8 is 240 and 9 is 400.
So looking here, note that the high-latitude A index (measured at the University of Alaska at Fairbanks) on March 11, 2011 is 56, a high value. The eight K index values are 4, 4, 5, 5, 5, 7, 6 and 4. Those convert to A values of 27, 27, 48, 48, 48, 140, 80 and 27. The sum of those is 445. Divide by eight and the average is 55.625, which rounds out to 56, the A index for the day.
Bert Ingalls, KH6HI, operates a 6 meter beacon in Hawaii on the island of Oahu. The KH6HI/B beacon is on 50.0645 MHz and runs 20 W into a pair of horizontally polarized loop antennas stacked vertically at about 2/3 wavelength, or 12 feet apart. It is at a commercial broadcast site in the Waianae mountain range 2500 feet, with an unobstructed shot to the horizon in all directions.
On Saturday, March 12, LW3EX in Buenos Aires reported hearing the beacon at 2349 with an RST of 539. The distance between grid squares BL01 and GF05 is about 7600 miles. Bert wrote: “I believe the following report is the first TE/F2 to South America from Hawaii for Solar Cycle 24. It occurred at 1:49 PM local time, which is typical for TE/F2 in that direction during previous solar cycles. I would expect that propagation to ZL/VK and other South Pacific islands will begin to occur as well, providing the solar flux continues to remain at current or higher levels.”
Bob Forsman, WK5X, of Stuarts Draft, Virginia, wrote about the recent report of possibly very long distance Argentina to North Carolina 2 meter propagation, and notes that this type of report isn’t unprecedented. He found a couple of reports from 1979 and 1981 in the March 2010 “World Above 50 MHz” column in QST, and included these with some of his own comments.
“The December 1981 “World Above 50 MHz” column details a September 23, 1981 (evening) occurrence of 2 meter propagation between CP5CL (Cochabamba, Bolivia) and the WB5QFM 2 meter repeater near Arcadia, Louisiana. It is interesting that this path, along with last week’s path, both occurred during an equinoctial (but opposite) period. The South American station was full quieting into the Louisiana repeater for 30 minutes, and then dropped to about 3 × 5 for a couple of hours. LU1DMA reports a QSO on 2 meter SSB with Steve, WB9YWN (now AF9X), on March 1, 1979 (last week’s report was from March 2). After tracking down AF9X, it was determined that Steve was likely operating either maritime mobile from the vicinity of Bermuda, or fixed from Charleston, South Carolina. These paths are not dissimilar to the path reported last week.”
All times listed are UTC, unless otherwise noted.
Amateur solar observer Tad Cook, K7RA, of Seattle, Washington, provides this weekly report on solar conditions and propagation. This report also is available via W1AW every Friday, and an abbreviated version appears each Thursday in The ARRL Letter. You can find a guide to articles and programs concerning propagation here. Check here and here for a detailed explanation of the numbers used in this bulletin. An archive of past propagation bulletins can be found here. You can find monthly propagation charts between four USA regions and 12 overseas locations here. Readers may contact the author via e-mail.
Yaesu Factory Damaged in Earthquake
In a letter to the Amateur Radio community, Vertex Standard Chief Executive Officer and President Jun Hasegawa expressed his “sincere appreciation to all of you for your kind words and thoughts about us” after the devastating 8.9 earthquake that struck Japan last week. Vertex Standard is the parent company of Yaesu.
All Vertex Standard employees and their families are safe and unhurt, Hasegawa said, but the company has not been able to reach many of their dealers and subcontractors who are located on the coast area: “We just hope that they are alive."
 Hasegawa said that a Vertex Standard factory in Fukushima was damaged in the earthquake. Even though the factory is not located near the coast and the damage was minimal, he said that Vertex Standard has decided to “disable the operation at this moment.” Saying that they are working very hard to get the factory back to its normal operation, Hasegawa said that “it may take one to two weeks to restart operation in the Fukushima factory. I would like to ask for your understanding and cooperation at this time.”
All Vertex Standard employees and their families are safe and unhurt, Hasegawa said, but the company has not been able to reach many of their dealers and subcontractors who are located on the coast area: “We just hope that they are alive."
ICOM, Kenwood Issue Statements Regarding Effects of Earthquake on Operations
After the 8.9 earthquake struck Japan last week, both ICOM and Kenwood, as well Yaesu, have issued statements how the natural disaster has affected their operations. Yaesu had reported that one of their factories in Fukushima was damaged and will be closed for “one to two weeks.”
ICOM
According to a press release, no one from ICOM is known to be injured. No damage has been reported at ICOM’s headquarters in Osaka, or at either of their two main factories in Wakayama; both Osaka and Wakayama are located far south of the most severely affected areas. The branch offices in Tokyo and Sendai, however, did suffer some minor damage. “Most of ICOM’s facilities and systems are ready to get back to normal business, but supplier logistics, commuting issues and future power disruptions will affect our company,” the press release said. “It is too soon to tell how big an impact the earthquake and its aftermath will have on ICOM. We appreciate your interest and concern.”
Kenwood
“Thankfully, our staff in Japan is safe due to earthquake preparedness and the special construction of our buildings,” said Kenwood USA President Junji Kobayashi on the Kenwood website. “Power outages and interruption of mass transit have kept most of Kenwood’s staff at home since the earthquake; however, we expect the infrastructure to improve in the coming week and our operations to fully resume accordingly. We appreciate the concern for our employees expressed by all those who have contacted us.” Kenwood’s primary office facilities in Yokohama and Hachioji were not damaged, due to their proximity further south and west of the quake’s epicenter. Since Kenwood’s primary manufacturing facilities are in Malaysia, electronics production is unaffected.
Subscribe to:
Posts (Atom)